Volume Profile Delta histogram and Footprint. 1-hour segments. Coarse resolution level size. Volume Delta. Histogram sizes relative to segment with highest price level volume. Price level volume metric number display over histogram. Diagonally evaluated Volume Delta Imbalance indication by cell background fill color. Segment volume metric number display above or under histogram. 30-minute segments. Laterally evaluated Volume Delta Imbalance indication by cell text color. 15-minute Volume by Time period.
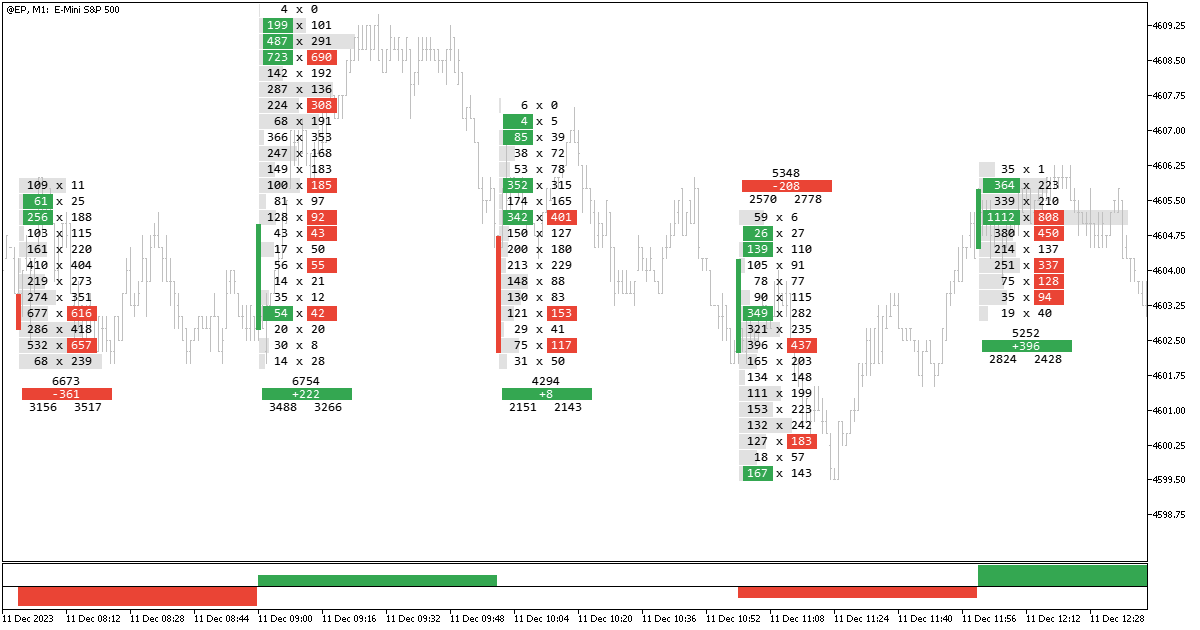


Chart Template Documentation


Market Profile displays the quantity and indices of time periods where prices occurred per price level. Units are named TPO's, short for Time Price Opportunity. Market Profile is a charting technique by J. Peter Steidlmayer, a trader at the Chicago Board of Trade (CBOT), ca 1959-1985.
 Volume Profile Histogram
 Market Profile TPO Block Structure
Tick Volume is the quantity of data ticks, data used in analytics to represent activity based on data feed updates with classification by Price Action.
For third-party data connection with the indicator API simple, relatively low cost, custom programmatic functions (network connection and data formatting) might be required, the MetaEditor features an AI assistant (OpenAI GPT-4 models), and at MQL5.com Freelance work orders can be opened and developers selected.
The second mode History Ticks + Real-time Ticks stores data tick-by-tick on disk which is persistant on reinitialization.
Templates (.tpl extension) are to configure charts they contain chart property settings including configurations of all applications attached to it. Templates can be used via the menu bar or context menu.
INI files (.ini extension) are to configure advanced or less frequently used settings and can be edited with a text file editor. For indicator they contain input parameter settings and can be used via the indicator's properties window 'Inputs' tab by file path as text input parameter values.


General disclosure: Materials, information, and presentations are for data visualization software feature informational purposes only and should not be considered specific investment advice nor recommendations. Example composition chart template indicators shown configured with window chart ranges solely for best compatibility and usability among timeframes. Risk disclosure: Trading currencies, equities, indices and commodities involves substantial risk of loss and is not suitable for all investors. An investor could potentially lose all or more than the initial investment. Risk capital is money that can be lost without jeopardizing ones financial security nor life style. Only risk capital should be used for trading and only those with sufficient risk capital should consider trading. Past performance is not necessarily indicative of future results.